
Ms-8 Question bank (12)
Ms-8 Question bank
MS-8 December, 2015
Written by sales@mbaonlinepapers.com sales@mbaonlinepapers.comMANAGEMENT PROGRAMME
Term-End Examination
MS-8 December, 2015
MS-8 : QUANTITATIVE ANALYSIS FOR MANAGERIAL APPLICATIONS
Time : 3 hours Maximum Marks : 100
(Weightage 70%)
Note : (i) Section A has six questions, each carrying 15 marks. Attempt any four questions from this
Section.
(ii) Section B is compulsory and carries 40 marks. Attempt both questions.
(iii) Statistical tables may be supplied on request.
(iv) Use of calculator is permissible.
SECTION - A
1. A person pays a total of Z 975 through monthly installments each less than the former by Z 5. The
first installment is ! 100. In how many installments will the amount be paid ?
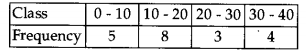
2. Calculate the harmonic mean from the following frequency distribution :
3. The incidence of a certain disease is such that on an average 20% of workers suffer from it. If 10 workers are selected at random, find the probability that :
(a) Exactly two workers suffer from the disease.
(b) Not more than 2 workers suffer from the disease.
4. Explain the meaning of sampling distribution of a sample statistic. Obtain the sampling distribution of mean in case of sampling from infinite populations.
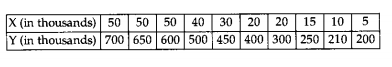
5. A company wants to study the relation between R and D expenditure (X) and sales (Y) for the ten-year period. Determine the correlation coefficient between these variables.
6. Write short notes on any three of the following :
(a) Identity matrix
(b) Quantiles
(c) Axioms of probability
(d) The power curve of a test
(e) Mixed Auto-regressive - moving average models
SECTION – B
7. The mean life of a sample of 10 electric bulbs was found to be 1456 hours with a standard deviation of 423 hours. A second sample of 17 bulbs chosen from a different batch showed a mean life of 1280
hours with a standard deviation of 398 hours. Is there a significant difference between the meansof the two batches ?
8. What is skewness ? Distinguish between Karl Pearson's and Bowley's coefficient of skewness. Which one of these would you prefer and why ?
MS 8 JUNE 2015
Written by sales@mbaonlinepapers.com sales@mbaonlinepapers.comMANAGEMENT PROGRAMME
Term-End Examination
June, 2015
MS-8 : QUANTITATIVE ANALYSIS FOR
MANAGERIAL APPLICATIONS
SECTION - A
1. The cost accountant of a company has derived 15the following expression relating total cost C to the number of units (x) of a product. C=1440 +125x + 0.1x2Find :
(a) The number of units (x) that will minimisethe average cost.
(b) The value of average cost and total cost corresponding to above number of units.
MS-8 1 P.T.O.
2. The residents of
3. In a factory, four workers are assigned to complete 15 an order received for dispatching 2000 boxes of a particular commodity. Worker A takes10 minutes per box, B takes 15 minutes per box,C takes 20 minutes per box and D takes 25 minutes per box. Find the average time taken per box by the group of workers.
4. An auto company decided to introduce a new six 15 cylinder car whose mean petrol consumption is claimed to be lower than that of the existing autoengine. It was found that mean petrol consumption for the 100 cars was 15 km per litrewith the standard deviation of 5 km per litre.Test for the company at 5% level of significance whether the claim that the new car petrol consumption is 14.50 km per litre on the average is acceptable. The critical value of Z at 5% level
of significance is 1.96.
5. Define Hypothesis. Explain various types of errors 15 in testing of Hypothesis. Describe various steps involved in the "Hypothesis Testing".
Ms-8 june 2007
Written by sales@mbaonlinepapers.com sales@mbaonlinepapers.comMS-8 june, 2007
MS-8 : QUANTITATIVE ANALYSIS FOR MANAGERIAL APPLICATIONS
1.Distinguish between decision making under certainty and decision making under uncertainty. Mention certain methods for solving decision problems under uncertainty. Discuss how these methods can be applied to solve decision problems.
2. Use Cramer's rule for a 3 x 3 system of linear equations to solve the following system :
2x - y + 3z =3
-x-y+3z= -6
x-2y-z= -2
3. From the data given below, compute the quartile deviation
|
Monthly wages (Rs) |
No. of workers |
|
Below 850 |
12 |
|
850-900 |
16 |
|
900-950 |
39 |
|
950-1000 |
56 |
|
1000-1050 |
62 |
|
1050-1100 |
75 |
|
1100-1150 |
30 |
|
1150 and above |
10 |
4. The members of a Consulting firm rent cars from three rental agencies : 60% from agency l , 30% from agency 2 and 10% from agency 3. if 9% of the cars from agency 1 need a tune-up 20%. of the cars from agency 2 need a tune-up and 6% of the cars from agency 3 need a tune-up, what is the probability that a rental car delivered to the firm will need a tune-up ?
5. To see whether silicon chip sales are independent of where the US economy is in the business cycle, data have been calculated on the weekly sales of a firm and on whether the US economy was rising to a cycle peak, at a cycle peak, falling to a cycle peak or at a cycle trough. The results are
|
|
|
|
|
|
|
|
High |
medium |
low |
total |
|
Economy at peak |
20 |
7 |
3 |
30 |
|
Economy at trough |
30 |
40 |
30 |
100 |
|
Economy rising |
20 |
8 |
2 |
30 |
|
Economy falling |
30 |
5 |
5 |
40 |
|
|
100 |
60 |
40 |
200 |
State the null hypothesis. At 0.10 significance level, what is your conclusion ?
(Given the tabulated value of test statistic is 10.645)
6. Write short notes on any three of the following :
(a) Concept of Maxima and Minima
(b) Types of classification of data
(c) Pascal Distribution
(d) Multi-stage sampling & Multi-phase sampling
(e) Box-Jenkins Models for Time Series
7. In order to test whether marathon races are bad for health, a researcher took a random sample of 400 runners who participated in the Delhi half-marathon and found that 13% of them got sick in the two-week period after the marathon. In a second sample of 400 runners who did not participate in the marathon, only 3% were sick in the same two-week period. What would be the null hypothesis ? Find
a 9o% confidence interval for the percentage of Delhi half-marathon runners who got sick in the two-weeks after the race.
8. A study by a roadways company on the effect of bus-ticket prices on the number of passengers produced the following results :
|
Ticket price Rs |
Passengers per 100 km |
|
25 |
800 |
|
30 |
780 |
|
35 |
780 |
|
40 |
660 |
|
45 |
640 |
|
50 |
600 |
|
55 |
620 |
|
60 |
620 |
Develop the estimating equation that best describes the data. Predict the number of passengers per 100 miles if the ticket were Rs. 10.